Results
The results from the BAM National Models are available at borealbirds.github.io for each species.

Species specific results
We walk through the results for Canada Warbler. The same results are available for all 143 species.
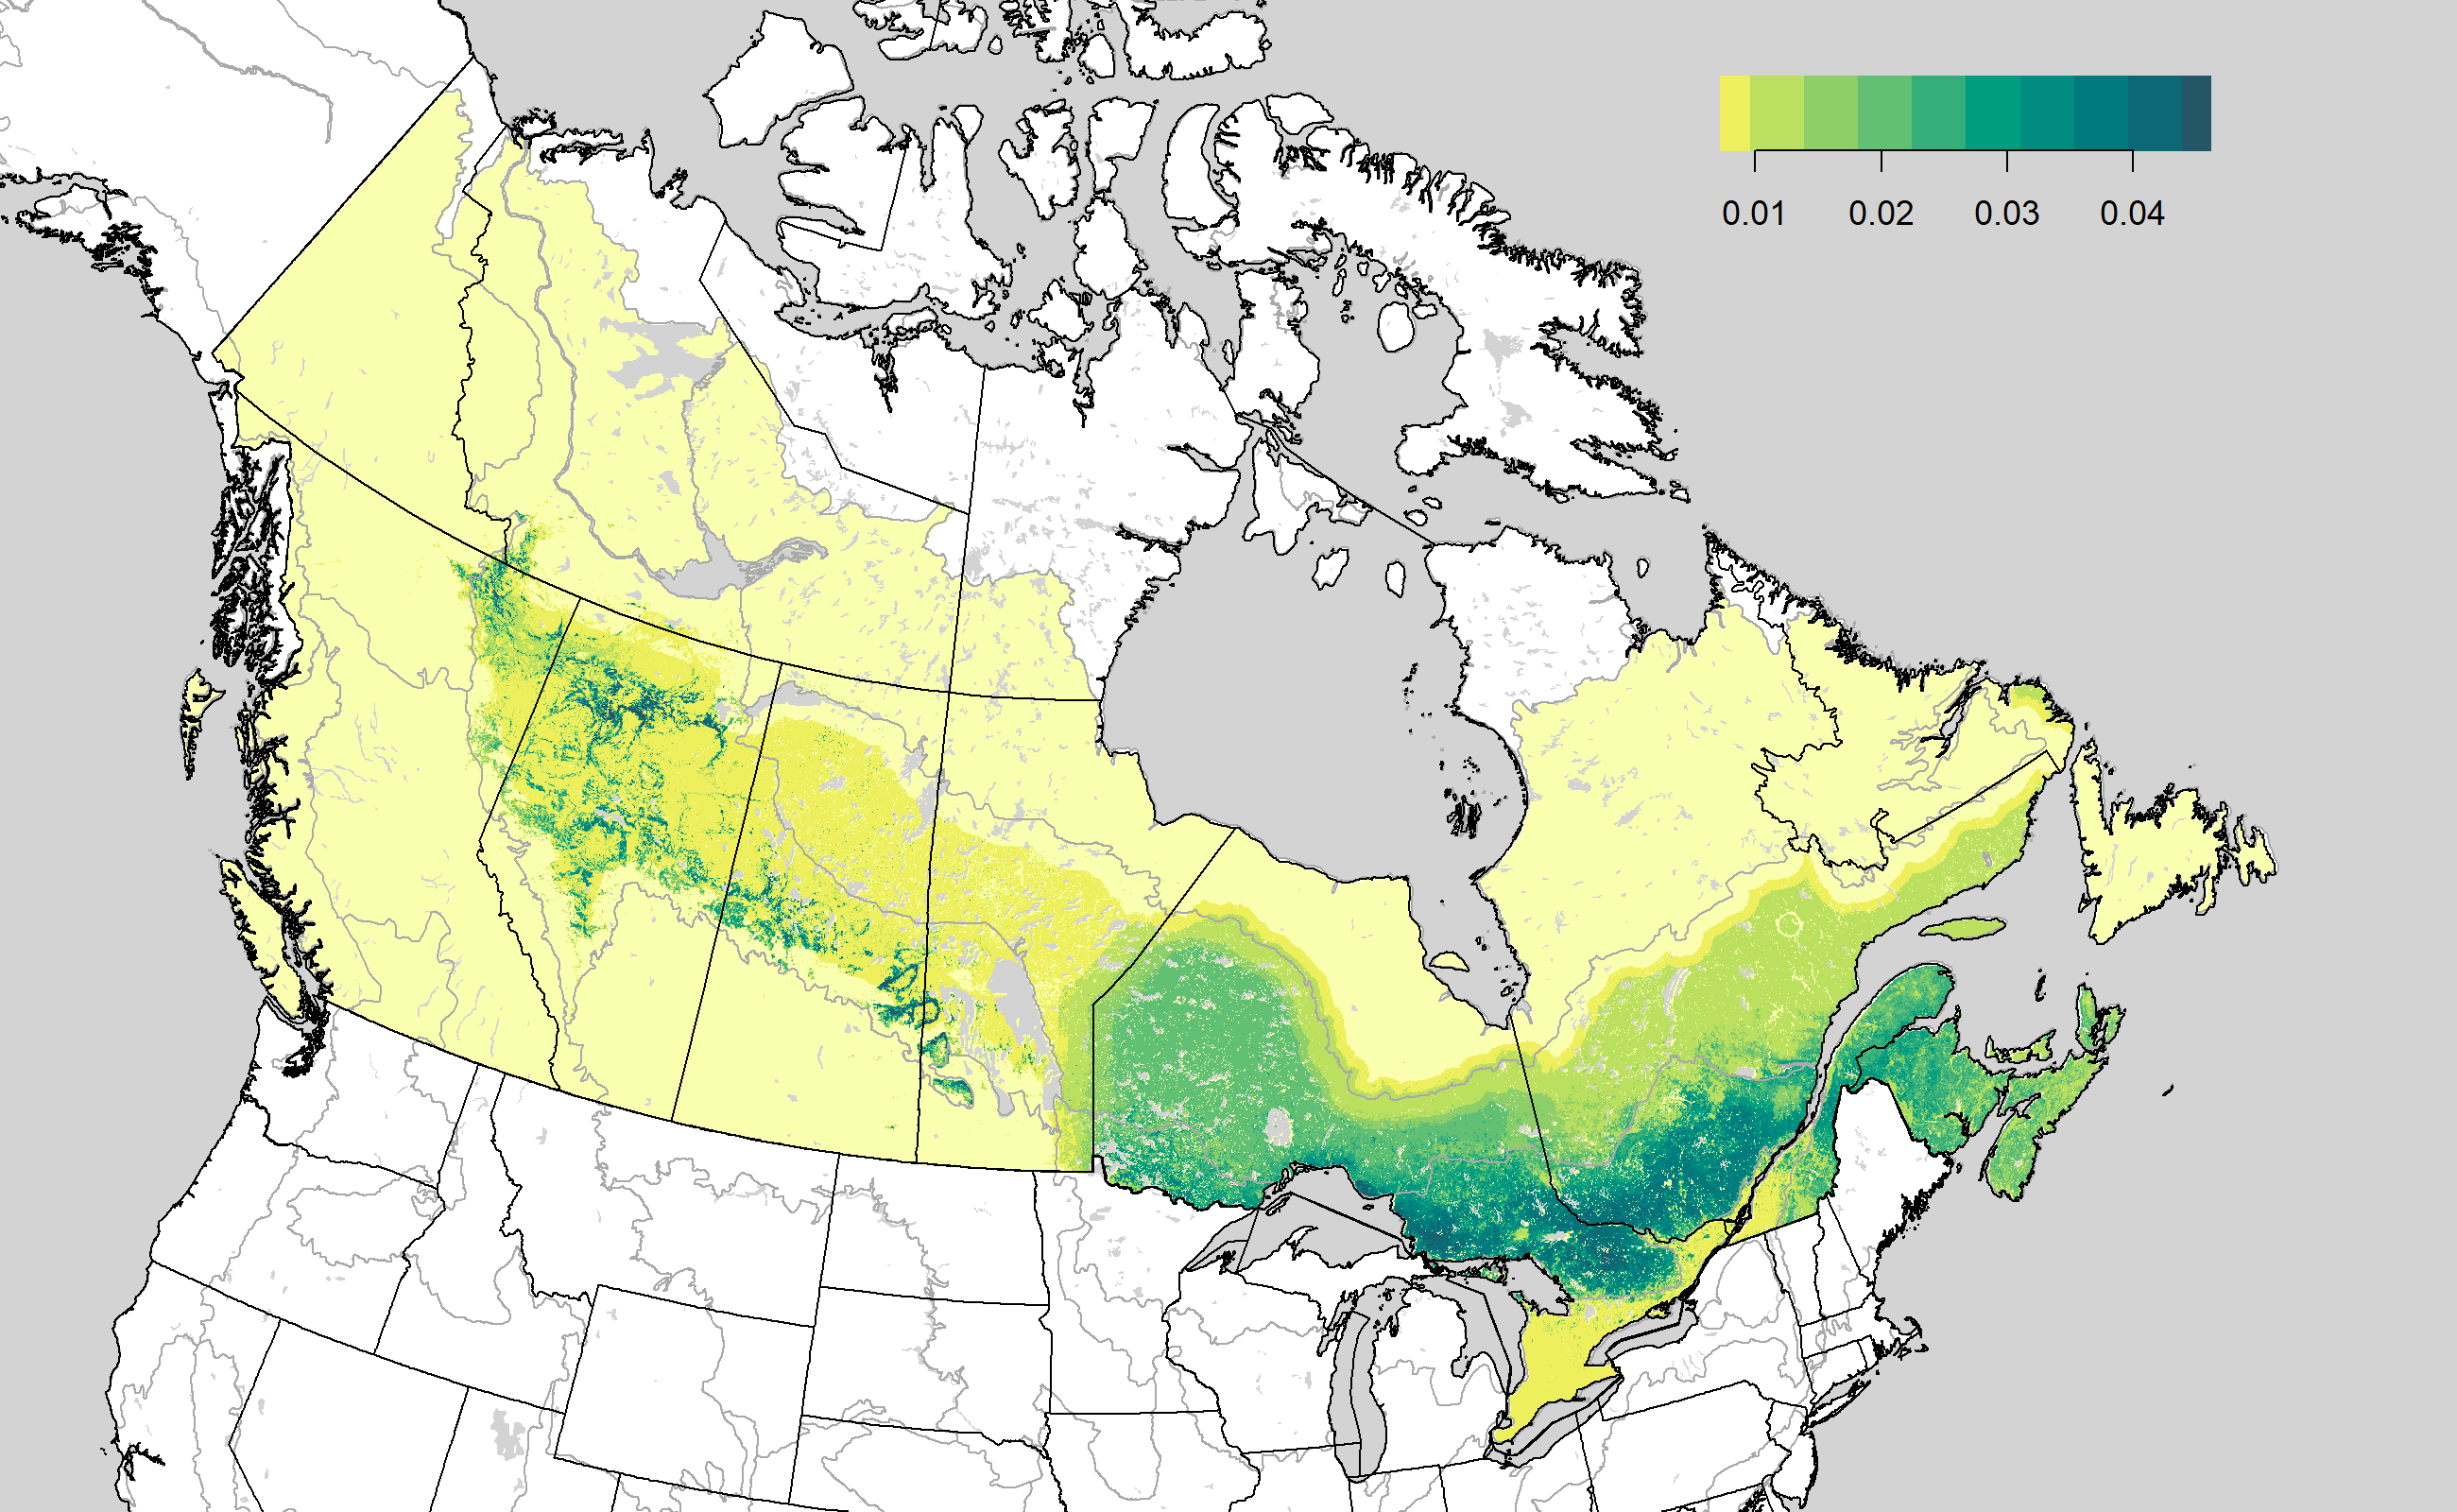
Density map
We developed separate models for each BCR subunit to improve local prediction accuracy and avoid out-of-range prediction. However, this resulted in some sharp transitions in predictions across certain boundaries that coincide with large regional differences in density. This variation in density across a large study area presented challenges for mapping, and we had to balance mapping detail with aesthetics to produce meaningful national maps. We emphasize that categorical map legends necessarily introduce subjectivity into the interpretation of species’ distribution and abundance patterns, and note that the legend breaks we used may not be the best ones for any particular mapping need. We encourage users to download the raster predictions and develop their own maps for regional applications.
Based on previous work, we started by developing maps that used mean density (males/ha) within the model-building area (Stralberg et al. 2015) as a presence/absence threshold, with areas of density below this mean density (“absence”) represented in light yellow. However, we found that this did not adequately describe the abundance patterns of all species, especially those that are widely distributed. So we adjusted the minimum thresholds according to visual alignment with known range limits. If maps based on these mean density thresholds resulted in a non-trivial number of occurrence locations mapped as absence (light yellow), then we sequentially adjusted these thresholds downward until that was no longer the case (starting with 0.05, then 0.01, then 0.001). 0.001 males/ha was the lowest density that we allowed to be used for this lower density threshold. Equal-interval legends, capped at the 99th percentile of predictions, were used to classify remaining density predictions for mapping.

The trade-off to this mapping approach is that there is perceived “over-prediction” in non-range areas (usually in the north, and often only in some BCRs). In some cases this may be related to range map inaccuracies in northern regions, but it also has to do with the sparsity of data in the north and the model’s inability to identify covariates that control presence/absence. Additional data are needed to map northern range limits more accurately.
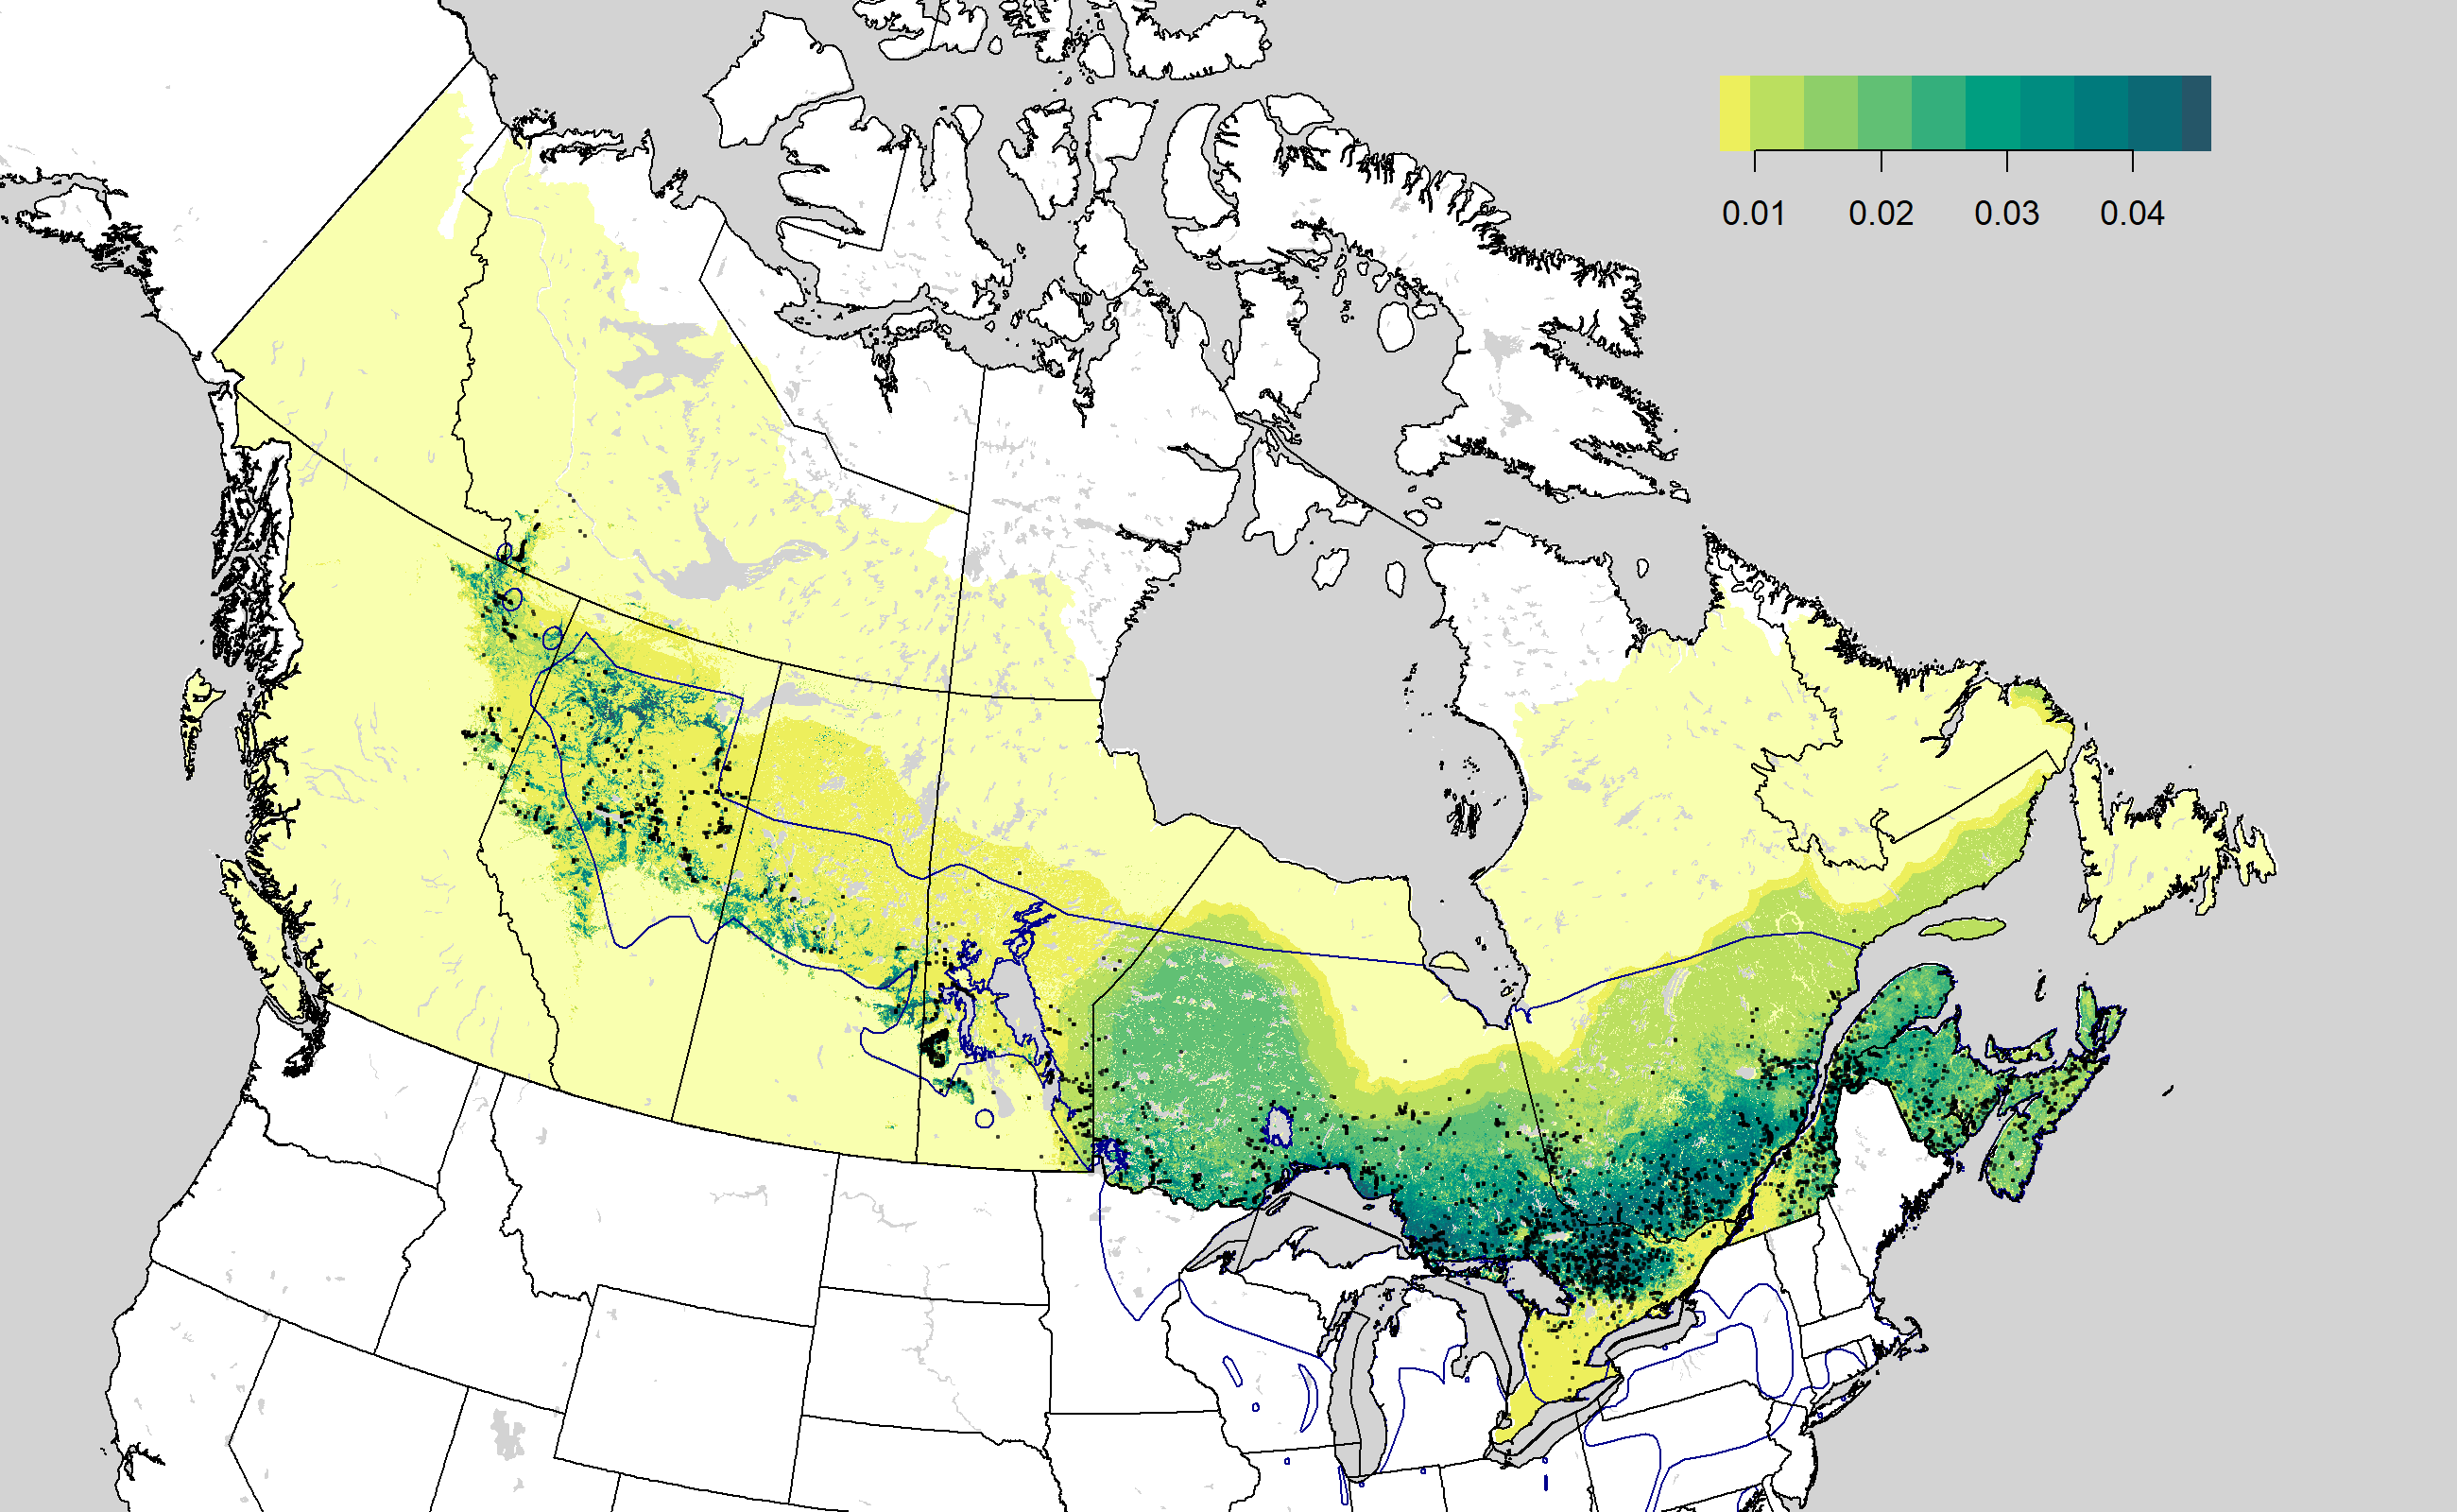
We also present the density maps with species’ detections and range map overlaid.

Land cover associations
We used a post-hoc stratification (‘post-stratification’) approach to estimate land cover based density estimates (males per ha) for each species and regions (Canada and subunits). We classified the predictive maps according to the 2005 MODIS-based North American landcover map into major land cover types (Conifer, Taiga Conifer, Deciduous, Mixedwood, Shrub, Grass, Arctic Shrub, Arctic Grass, Wetland, Cropland) and calculated the mean of the pixel level predicted densities. Uncertainty was based on the 5th and 95th percentiles of the bootstrap distribution.
Population size
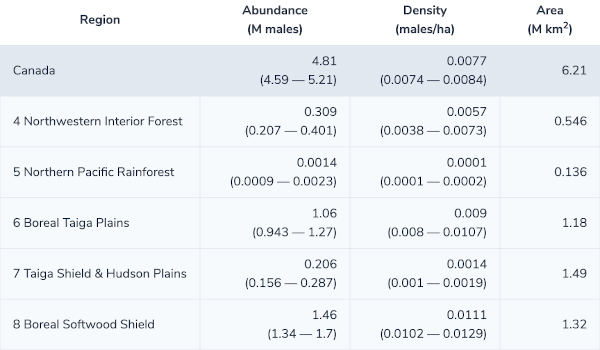
Regional population estimates (millions of male individuals) for each species and regions (Canada and subunits) were estimated by summing up the pixel level predictions within the region of interest accounting for the area difference (ha to km2). Uncertainty around the population estimates was based on the 5th and 95th percentiles of the bootstrap distribution.

Downloadable material
Average density maps for each species are available for download as raster layers in GeoTIFF format.
Result summaries are also available in Microsoft Excel (xlsx) format. Sheets within the file contain abundance and density estimates and also the list of species, variables, variable importance and validation metrics.
Programmatic access
Population size and density estimates are available through the Boreal Birds JSON API.
Results include static images and data in JSON (JavaScript Object Notation) format that can be consumed by a wide array of modern programming languages.
